WHAT ARE VIDEO ON DEMAND AUDIENCES WATCHING?
One of the major problems that producers and studios are struggling with is the lack of transparency in the new distribution landscape. It is currently quite difficult to see how a film has performed in Video on Demand (VOD) and there has been no significant analysis into what types of films are best suited to these new distribution streams.
Pulling together data from a number of sources (including VOD ranking data) we have been able to look at what VOD audiences want to watch and how this compares with other media. The nature of the data means we can’t provide the level of granular detail we normally strive for, but we have been able to group films into one of four categories:
- Thrilling, covering horror, thriller and suspenseful movies
- Spectacular, covering action and adventure movies
- Amusing, covering comedy, romantic comedies and musical movies
- Other, including drama, documentaries, westerns, concert films and everything else not covered by the previous three categories.

You can find more detail about our methods and data at the bottom of this article.
What Are Theatrical Audiences Watching?
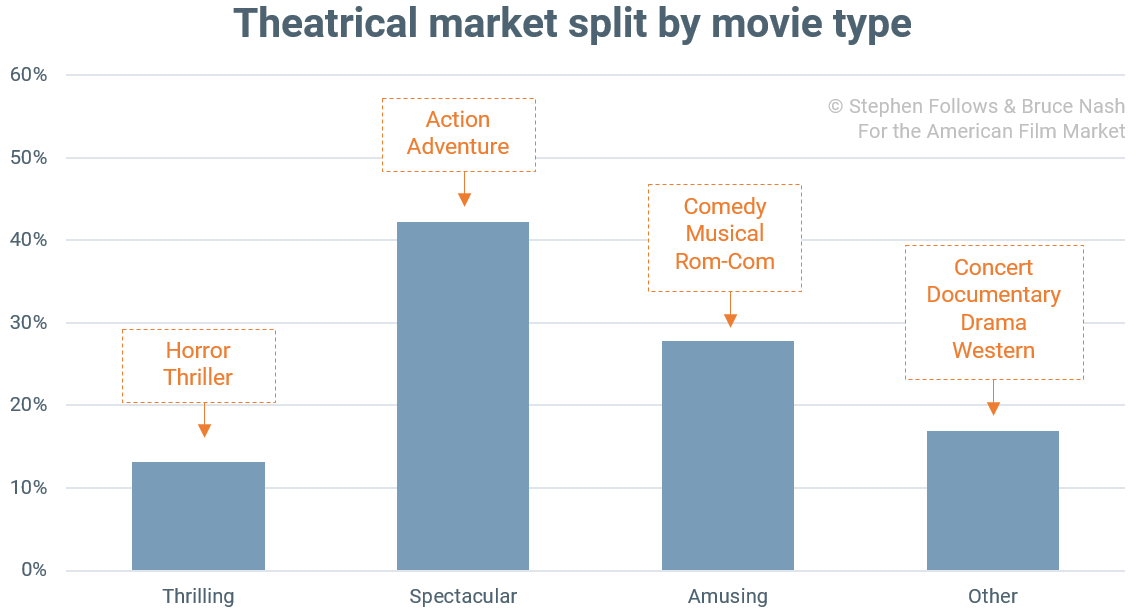
We’re going to start where most movies start their recoupment journey – in movie theatres. Unsurprisingly, our category labeled Spectacular movies perform very well, taking close to half of the market share.
What Audiences Physically Rent in Stores and Via Redbox
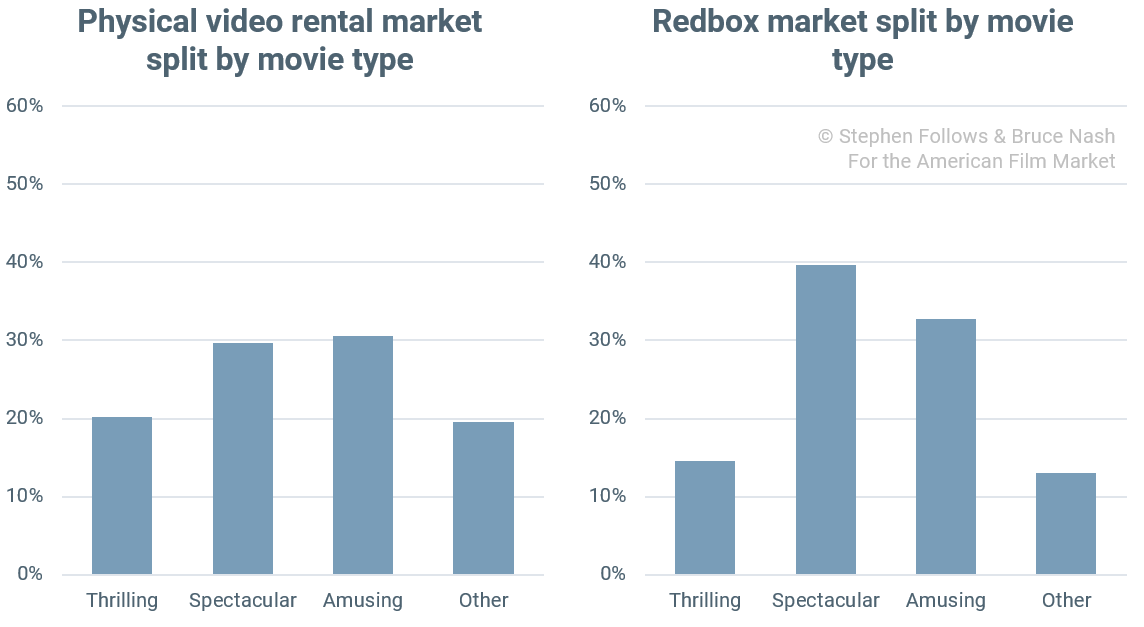
Historically, videos rented in stores (such as the now long-forgotten Blockbusters) spanned our four categories much more evenly than the theatrical marketplace. Thrilling movies held almost twice the market share than they did in cinemas and Amusing movies just outperformed Spectacular movies.
A successor to Blockbuster is Redbox, which rents physical DVDs via automated kiosks. The difference between the rental market is clear in the charts below, with Redbox’s audience acting more like the modern theatrical audience than the previous generation of Blockbuster customers.
The rental market is going through a period of rapid change, with Redbox starting 2015 as the number one provider but ending the year in third place, behind Amazon and iTunes.
What Do Audiences Purchase on DVD and Blu-Ray?
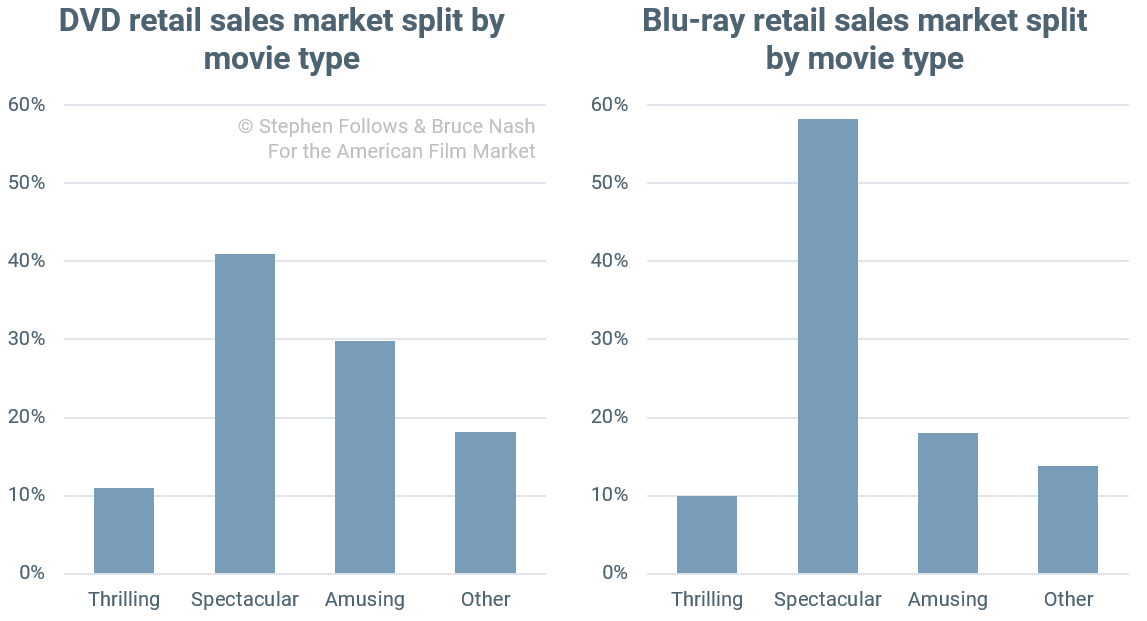
DVD and Blu-ray sales are declining but still have the capacity to bring in the big bucks. The US market grossed $6.1 billion in 2015 alone, with 78% of units sold being DVDs, and Blu-rays accounting for the remaining 22%.
The audiences for movies on the two media formats differ significantly, with Blu-ray consumers placing a much greater focus on movies that benefit most from the format’s increased video and audio quality. Action and adventure films led the way, taking 58% of Blu-ray sales, compared to a market share of 41% on DVD.
What Do Audiences Buy and Rent on iTunes?
Finally, we move onto VOD, specifically iTunes. Between 2014 and 2105, physical video sales fell by 12% while digital revenues rose 18%. This looks promising, although it’s still under a third of the size of the physical video market.
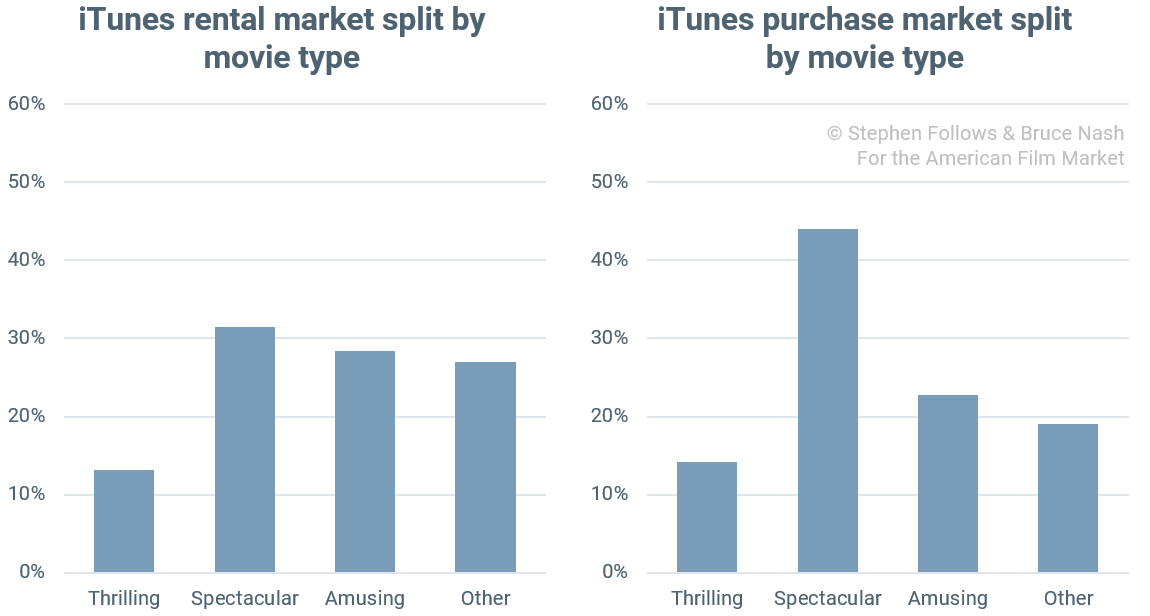
The iTunes rental audience closely matches the audience for pre-digital physical video rentals, but the VOD purchase audience matches the theatrical audience.
Anecdotally, we’ve heard rumblings from horror producers that the shift from physical video to VOD has put their genre under particular pressure. Looking at the data within the ‘Thrilling’ pool of movies confirms that this is the case.
Horror movies account for 4.5% of the theatrical market and in the past made up 4.8% of the physical video rental market. However, they now account for 2.1% of Redbox rentals and under 1% of both iTunes retail and iTunes rental markets. It appears that the shift in distribution technologies is presenting a problem for the post-theatrical horror market.
The Shift In Revenues Over the Past Five Years
To get an idea of how these market changes will affect revenue in each sector, we performed one further piece of analysis. We looked at the overall breakdown of consumer spending for movies in the United States between 2010 and 2015. This five-year period has seen a steep decline in sales of DVDs and rentals of physical disks, combined with significant growth in digital delivery, in particular VOD and Electronic Sell-Through (EST) and in subscription streaming services (with Netflix to the fore).
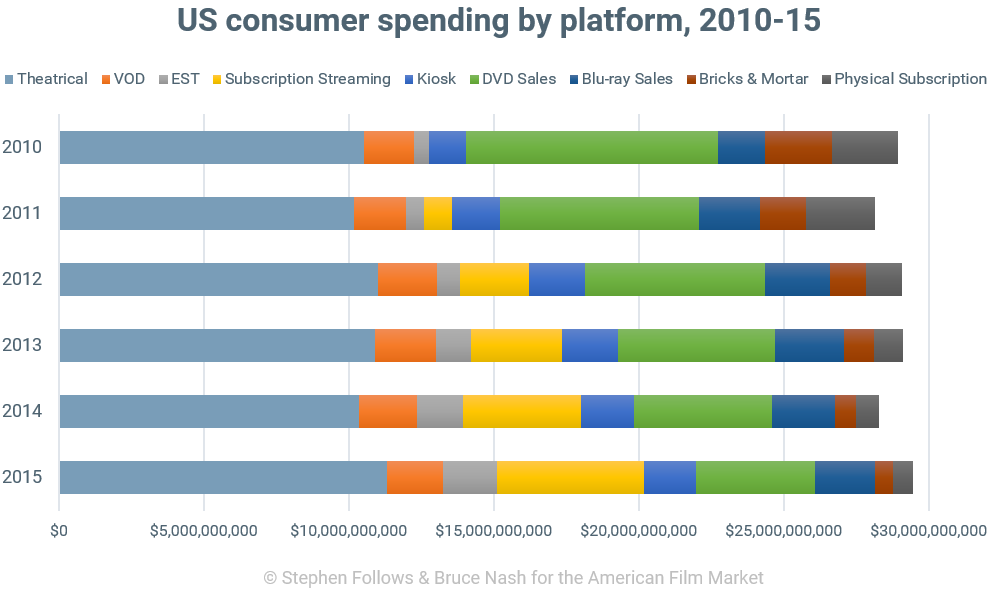
By multiplying our market share estimate for a genre in a particular market by the size of that market each year, we can get an idea of the spending in that market for that genre. For example, drama films have roughly 24% share of the rental market on iTunes, based on our model. The VOD market in 2010 was about $1.75 billion dollars (according to the Digital Entertainment Group), so we can estimate that about $420 million ($1.75bn x 24%) was spent on drama films on VOD in 2010. In 2015, the VOD market was $1.94 billion, so spending on drama films on VOD was approximately $467 million: an increase of $57 million, thanks to the expansion of the VOD market.
Doing this for all markets (except for subscription streaming… see our comments below), and all genres reveals the change in revenue by movie type from 2010 to 2015:
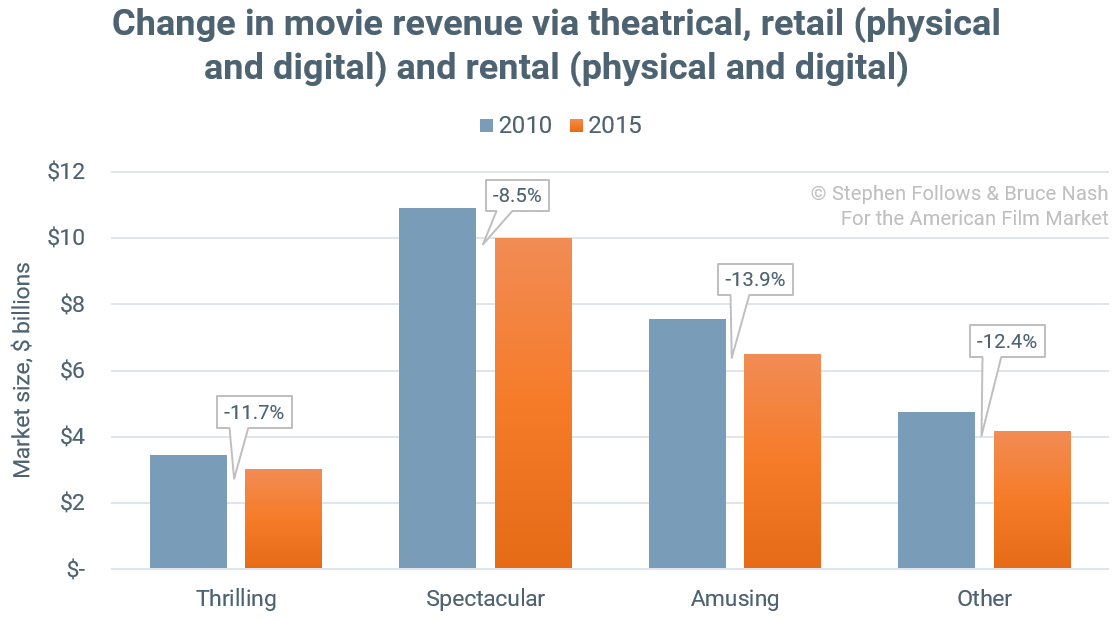
The genres that were hit hardest by the shift to digital distribution are comedies and musicals. The reasons for that are two-fold: comedies and musicals sold well on DVD, but are selling poorly on Blu-ray, and they did marginally better as physical rentals (from Blockbuster and Redbox) than they did as VOD and EST digital purchases.
Just behind come the “other” category, which is dominated by drama. That’s down 12.4% due to the shift in consumer spending. Horror and thrillers are down just under 12%, with a notable shift from straight horror films to thrillers. And the genres least affected by the digital shift are action and adventure.
The Shift to SVOD is Reducing Transparency
The principal reason why spending on all these genres has gone down over the past five years is that there’s been a shift to subscription streaming. Streaming barely existed in 2010 and is now a $5.5 billion industry, dominated by Netflix.
Unfortunately, the major SVOD providers are staying extremely tight-lipped about how movies are performing in this new release window. We don’t have any reliable data about deal terms, fees, viewing figures – or anything else which would be useful to provide market analysis. It seems unlikely that this kind of black box accounting will continue indefinitely but, for now at least, the film industry is completely in the dark about what works on SVOD.
This presents a growing problem for filmmakers as more of the money shifts from areas we can track, to those we cannot.
5 Billion Steps Back, 14 Billion Steps Forward
Putting to one side the matter of transparency, the shift towards SVOD services is changing the economics of distribution. Our figures suggest that subscription streaming (SVOD) services have shifted about $4.6 billion in consumer spending away from other channels.
However, it’s also true that SVOD providers are spending heavily on content. In addition to Netflix’s $5 billion, Amazon is rumoured to be spending about $2 billion per year, YouTube may pay as much as $5 billion per year to content creators through revenue shares on advertising. Add in various speciality platforms, such as Fandor, Shudder and Crunchyroll, and the likes of HBO’s online offering, Hulu and Vimeo, and as much as $14 billion in new spending is coming into the business.
While a lot of that money is going to existing film libraries, TV shows and YouTube stars, that still leaves many opportunities for independent filmmakers to find new niches.
Notes
VOD sales, rental and viewing figures are not publicly available en masse and so we had to turn to creative methods to sample the market. To do so, we used a two-step process. First, we looked at the market share in the theatrical market, based on data from The Numbers, using US box office from January 2000 to August 2016. We then built a model that estimated those market shares based on the ranks of movies in the top 20.
So, by looking at all the films in the top 20 each week, we used the model to estimate market shares for each genre in the theatrical market. We then applied that model to each of the markets we wanted to look at. This allowed us to get a sense of the market shares for different genres while knowing only the ranks of movies in the chart (which is all that’s publicly available for iTunes, Redbox, and various other online outlets).
By restricting our film groupings into four categories, we were able to minimize the absolute error in estimates (for example, by combining comedy, romantic comedy and musicals, we could look at a group of films that command a significant market share, rather than worrying if a change in market share for musicals (for example) from 1% to 2% was meaningful).
In the charts, theatrical market shares are based on The Numbers’ tracking of domestic box office; DVD and Blu-ray retail sales shares are based on The Numbers’ estimated sales from weekly retail tracking, Bricks & Mortar video rental shares are based on reported rentals by Rentrak for video stores, iTunes and Redbox figures are estimated based on the model described above.
The time period we considered for each market was the longest period for which we had comprehensive data. Specifically:
- Theatrical Box Office – January 2000 to August 2016
- iTunes Rental – June 2014 to August 2016
- iTunes Purchase – June 2014 to August 2016
- Redbox Rental – August 2014 to August 2016
- DVD Retail Sales – January 2006 to August 2016
- Blu-ray Retail Sales – August 2009 to August 2016
- Bricks & Mortar Video Rental – September 2009 to June 2014
About the Authors
Stephen Follows is a writer, producer and film industry analyst. His film research has been featured in the New York Times, The Times, The Telegraph, The Guardian, The Daily Mail, The Mirror, The Evening Standard, Newsweek, The News Statesman, AV Club and Indiewire. He acted as an industry consultant and guest on the BBC Radio 4 series The Business of Film, which topped the iTunes podcast chart, and has consulted for a wide variety of clients, including the Smithsonian in Washington. In addition to film analytics, Stephen is an award-winning writer-producer and runs a production company based in Ealing Studios, London.
Bruce Nash is founder and President of Nash Information Services, LLC, the premier provider of movie industry data and research services and operator of The Numbers, a web site that provides box office and video sales tracking, and daily industry news. Mr. Nash founded the company in 1997 and it now serves approximately 1,000 clients, from the major studios to first-time independent filmmakers. Mr. Nash provides regular commentary and analysis for media outlets, including the L.A. Times, the New York Times, Variety, the Wall Street Journal, 60 Minutes, and CBS News. Mr. Nash is the official adjudicator of movie records for the Guinness Book of Records. To learn more about his company’s services, visit Nash Information Services.
Copyright © 2021 Stephen Follows and Bruce Nash. All rights reserved. Reproduced with permission.
Explore more articles and research at Producers Resources.


